AquaHarmonics Wins the Energy Department’s Wave Energy Prize

Winners_640x480-2.png
CalWave Power Technologies and Waveswing America Named Runners-Up in $2.25 Million Prize Challenge

WASHINGTON (Nov. 16, 2016) – Today the U.S. Department of Energy’s (DOE) Office of Energy Efficiency and Renewable Energy announced AquaHarmonics as the winner of the Wave Energy Prize – which comes with a $1.5 million grand prize. CalWave Power Technologies and Waveswing America were awarded second and third place, respectively, with $500,000 and $250,000 in cash prizes. With more than 50 percent of the U.S. population living within 50 miles of coastlines, there is vast potential to provide clean, renewable electricity to communities and cities across the United States using wave energy.

An 18-month design-build-test competition, the Wave Energy Prize focuses on catalyzing the development of game-changing wave energy converters that will ultimately reduce the cost of wave energy. Wave energy technology could one day provide clean, cost-competitive, reliable energy for homeowners, communities, businesses, and government in geographically suited parts of the United States.

“The Wave Energy Prize marks a significant advance for marine energy,” said Lynn Orr, DOE’s Under Secretary for Science and Energy. “This competition set a difficult threshold of doubling the energy captured from ocean waves, and four teams surpassed that goal. AquaHarmonics’ technology leap incentivized by the Energy Department demonstrates how rapid innovation can be achieved in a public prize challenge.”

Ninety-two teams registered for the prize beginning in April 2015. Over the course of the competition, a panel of judges ultimately identified nine finalists and two alternates, which were announced in March. These teams received up to $125,000 in seed funding to build scaled prototypes of their wave energy converter devices. With the support of the U.S. Navy, the finalist teams tested their prototype devices at the nation’s most advanced wave-making facility, the Naval Surface Warfare Center’s Maneuvering and Seakeeping Basin at Carderock, Maryland.

Wave energy is produced by converting the energy from waves into electricity. It has the potential to be a substantial resource to deliver renewable energy to the United States. The wave energy sector is in its early stages of development, and the diversity of technologies makes it difficult to evaluate the most technically and economically viable solutions. The Wave Energy Prize Competition has addressed this challenge by comparing a wide range of device types and evaluating them against a threshold requirement for high energy capture. The Prize has already facilitated rapid technical innovation, and in the next year, the Energy Department will publish data from all the finalist teams’ test results to further accelerate advancement of this sector.

“It’s been a project we’ve been working on since even before the Wave Energy Prize was announced,” said Max Ginsburg from AquaHarmonics. “As we progressed towards the finals, it just got more and more exciting.”

Go to water.energy.gov for information on the Water Power Technologies Office funding opportunities that sponsor the development of innovative technologies that generate renewable, environmentally friendly, and cost-competitive electricity from water resources. To see the full results of the competition or for more information about the Wave Energy Prize, go to waveenergyprize.org.

Watch LIVE: The results of the Wave Energy Prize on Nov. 16

winners_640x480-3-1

Will we have a winner? The Department of Energy will announce the results of the Wave Energy Prize during an Innovation Showcase to be held at Naval Surface Warfare Center Carderock Division on Nov. 16. Although attendance at this event will be by invitation only, the public is invited to watch the announcement live beginning at 10 a.m. ET.

Join us by logging on to http://energy.gov/live. Results will also be available on the Wave Energy Prize website following the event.

Wave Energy Prize winner(s) to be announced Nov. 16

carderock2

It has been a long road for our teams since registering for the Wave Energy Prize back in the spring of 2015. In 18 months, they have written technical submissions, test plans, and build plans; constructed 1/50th-scale models, completed small-scale testing, and numerically modeled their WEC’s performance; and finally, after building 1/20th-scale WEC prototypes, tested their devices at the Navy’s Maneuvering and Seakeeping (MASK) Basin in Carderock, Md. Nothing remains but to find out how many teams were able to meet or exceed the Prize’s goal of doubling the energy captured from ocean waves, and to ultimately announce whose technology met or exceeded the required ACE value and produced the highest HPQ.

The U.S. Department of Energy will announce the winner(s) during the Wave Energy Prize Innovation Showcase to be held at Naval Surface Warfare Center Carderock on Nov. 16. Attendance at this event will be by invitation only.

For our teams, whether they are the winner of the $1.5 million grand prize or not, Nov. 16 is not the end, but rather a new beginning. In the months following the Prize, the teams will analyze the data obtained during testing at the MASK Basin to help bring their innovative technologies to the market.

Testing Update

carderock-collage-lg

Ever since registering more than a year ago for the Wave Energy Prize, our teams have eagerly anticipated the opportunity to test their 1/20th-scale WEC prototypes in the Navy’s Maneuvering and Seakeeping (MASK) Basin, at Carderock, Md. In a building with a footprint of more than five acres, what developer wouldn’t be giddy with excitement to test a new technology in the nation’s premier wave-making facility containing more than 12 million gallons of fresh water?

The beginning of August marked the beginning of the final round testing, and some of our Finalist Teams have already completed their 1/20th scale model tests in the MASK Basin. Others are still awaiting their turn. M3 Wave was first in the tank, followed by Waveswing America, Harvest Wave Energy (Team FLAPPER), AquaHarmonics, CalWave Power Technologies, Oscilla Power and Sea PotentialRTI Wave Power is testing its prototype this week, and SEWEC is onsite building its device.

“Watching our Finalist Teams’ WEC concepts come to life at the MASK Basin has been a thrill,” said Alison LaBonte, Marine and Hydrokinetic Technology Program Manager in DOE’s Water Power Technologies Office. “We’re looking forward to the Judges’ analyses of the nine weeks of testing and learning how many and which technologies surpassed our goal of doubling the energy capture efficiency of wave energy converters.”

How does the Wave Energy Prize calculate ACE?

The goal of the Wave Energy Prize is to stimulate the development of innovative wave energy converters (WECs) that have the prospect for becoming commercially competitive with other forms of electricity generation.  Specifically, the Prize seeks to double the state-of-the-art performance of WECs. As mentioned in a previous blog, when comparing the economic attractiveness of power generating technologies, levelized cost of energy (LCOE) is a common metric frequently used in the power generation sector.  LCOE is the ultimate expression of the ratio between effort (cost) to benefit (energy generated).

Unfortunately, LCOE cannot be used in the Wave Energy Prize because the data needed to determine LCOE are either not available or are very unreliable at low Technology Readiness Levels (TRLs), and the Wave Energy Prize is fundamentally expecting to be operating with WEC technologies that are at low TRLs.

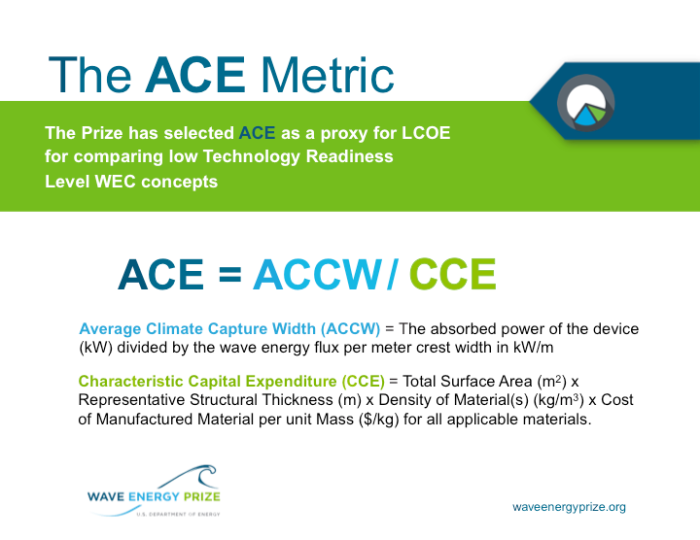
With support from Sandia National Laboratories and the National Renewable Energy Laboratory, the Prize team derived a new metric to determine effectiveness of low TRL concepts that is a modification of existing WEC metrics. Importantly, this metric allows for robust analysis of innovative WEC devices using novel methods and materials.  ACE is a benefit to cost ratio, and is a proxy for LCOE, appropriate for comparing low TRL WEC designs.

The two components that comprise the ratio ACE are described in full in the Wave Energy Prize Rules. In summary they are:

  • Average Climate Capture Width (ACCW) = a measure of the effectiveness of a WEC at absorbing power from the incident wave energy field.
  • Characteristic Capital Expenditure (CCE) = a measure of the capital expenditure in commercial production of the load bearing device structure.

Wave Energy Prize ACE Metric Slide

Analyses of the current state of the art reveals that existing WEC concepts achieve an ACE value of 1.5 m/$M (meters per million dollars). For WEC technologies that emerge from the Wave Energy Prize to be on a development trajectory to become commercially competitive, our analysis shows that in the Prize, WECs must achieve a minimum threshold value for ACE of 3 m/$M. Below is a detailed description of how to calculate ACE.

Average Climate Capture Width

The average climate capture width (ACCW)—the numerator of ACE—represents an expected yearly average capture width for a WEC operating in typical West Coast wave climates. ACCW is calculated from a set of WEC capture widths for a select set of irregular wave conditions that are either measured in sub-scale physical model testing or calculated from numerical simulations.  The full scale capture widths are weighted by the yearly occurrence of the specified test wave conditions at select locations and summed to yield the ACCW.  This means that a device that performs very well in one sea state but poorly in other sea states may have a relatively low ACCW when compared with the maximum capture width.  Alternatively, a device that has modest performance over a wide range of sea states and wave directions may have a higher ACCW.

Calculating ACCW

ACCW is calculated in two steps, first by calculating the average annual capture width (AACW) for each wave climate of interest through weighted absorbed power measurements in the sea states of each wave climate, and then by averaging the AACW values to give ACCW.  For more details on these calculations, see Appendix I of the Wave Energy Prize Rules.  Below is a description of the approach for determining which tests to perform to determine ACCW, followed by a simple illustration of calculating AACW and ACCW.

Both tank testing and numerical simulations must cover enough sea states to represent a realistic wave climate. Simulations should be performed in enough irregular sea states that the power in every bin of the resource matrix, or joint probability distribution (JPD), at the wave climate can be approximated. For tank testing, testing at every sea state bin at the wave climate would be over burdensome, but enough sea states should be tested to represent the characteristics of that climate.

In both cases, the sea states that are tested should be weighted so that average annual power absorbed for a particular wave climate can be estimated. (This scaling is represented by Ξ in Appendix I of the Wave Energy Prize Rules.)  The resulting dataset will be a power ma­trix of device power absorbed for significant wave heights and energy periods that cover the range of sea states experienced at the wave climate of interest.  Multiplying the power matrix by the JPD and summing the values of the matrix yields the average device power absorbed for a particular wave climate. The average power absorbed is then used to determine the average annual capture width.

For example, for a particular wave climate, if the average power absorbed by a WEC is 90 kW and the average annual wave resource is 30 kW/m, the WEC would have an AACW of 3m.

P average absorbed = 90 kW

P resource = 30 kW/m

AACW = ( P average absorbed (kW) / P resource (kW/m) ) = 3 m

Per Appendix I of the Wave Energy Prize Rules, ACCW will then be given simply by averaging the AACW for all wave climates of interest.

Characteristic Capital Expenditure

Prior analysis performed at NREL shows that the largest contributor to wave energy LCOE is the structural cost of a WEC, and in the Prize, the Characteristic Capital Expenditure (CCE) is used to estimate the structural cost of a device (CCE and RST were discussed in a previous blog post, and are discussed in more detail here). The device structure accounts for the mass of any and all load bearing structures that are critical to the power conversion path. This includes:

  1. Any structure that interacts with the wave environment
  2. Any supporting structures used to resist forces in the power conversion chain in the load path/force flow path
  3. Any significant load-bearing foundation components

This implies that for a heaving buoy, for example, not only must the structure of the buoy be used to calculate CCE, but the structure of the gravity base itself must also be used. For offshore devices that require substantial structures, such as jack up barges, those structures must be included as well.

Once the structure is defined the CCE of a device is calculated using the following equation:

CCE = RST * Asurf * ρ * MMC

where:

  • RST = representative structural thickness [m]
  • Asurf = total structural surface area [m2]
  • ρ = material density [kg/m3]
  • MMC = manufactured material cost [US$/kg]

If more than one structural material is used in a device, the individual CCEs for each material are summed to give a total CCE.  Below are details on calculating each of the variables above for a single material in a device.

Representative Structural Thickness

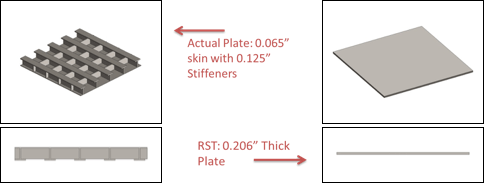
The representative structural thickness (RST) mentioned in the above equation is a scalar that is used to determine the total structural mass when multiplied by the surface area of the material. The RST can be visualized as a single uniform thickness obtained by “melting down” all of the structural components of a material, and then “casting” the shape of the WEC with a constant wall thickness, the RST. This means that all stiffeners and support structures are “lumped” together. A simple representation of the RST is shown below with a flat plate. The original structure includes a grid of stiffeners with a thin hull. That same quantity of material is then represented by a solid plate with the thickness given by the RST.

plate1.png

Manufactured Material Cost

The last critical variable to calculate CCE is the manufactured material cost (MMC). This value represents the total cost to manufacture the material used in a device at full production scale. Therefore, the MMC includes the raw material cost, any fabrication, forming, and assembly.

In practice, the value of MMC will fluctuate due to material suppliers, complexity of device, number of devices, along with many other market factors. For example, the raw cost of structural steel may be approximately 1 $US/kg but by the time any forming, cutting, or welding is made the MMC may be closer to 3 $US/kg at full production. For a device already built, one can back out the MMC by dividing the total cost to build the device using a particular material by the mass of that material used.

Summary and Example Calculation of RST, CCE, and ACE

Once all the above variables have been defined, one can calculate the RST, CCE, and ACE values for any wave device. Below is an example calculation using cost and performance estimates from the DOE MHK Reference Model #5 which is made of steel and is assumed to operate offshore of Humboldt Bay, Calif.  The absorbed power for Reference Model #5 was simulated at each sea state using the numerical code WEC-Sim developed by the National Renewable Energy Laboratory and Sandia National Labs:

eq1.png

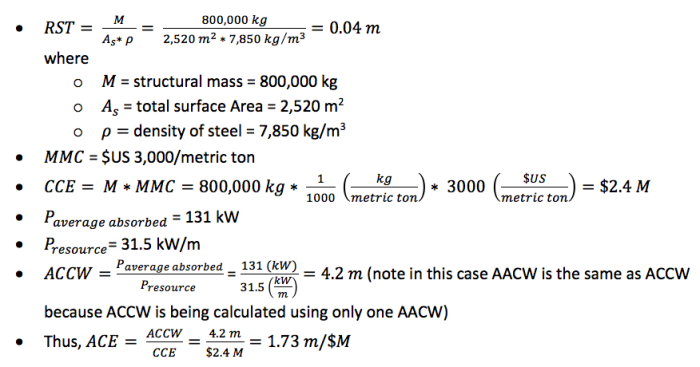
Using this method one can estimate and compare the economic viability of different devices at an early stage. However, one must be careful when employing this method for devices that have different percentage breakdowns with regards to structure, power take-off, mooring, etc. In these situations, and when comparing devices, a more reliable method would be to include all capital costs in the CCE. If all the initial capital costs were included, the CCE would increase from $2.4M to $4.97M, yielding an ACE of 0.84 m/$M.


Armed with Science: The Navy’s Indoor Ocean

As many teams mentioned during the Wave Energy Prize Team Summit in April 2016, the Finalists are incredibly excited to test their 1/20th-scale WEC prototypes at the nation’s premier wave-making facility, the Naval Surface Warfare Center’s Maneuvering and Seakeeping (MASK) Basin, at Carderock, Md. With testing beginning in less than two weeks, let’s take a closer look at this unique facility, which was featured in the official U.S. Department of Defense science blog, Armed with Science, last year. More »

Wave Energy Prize teams discuss their prize-challenge experiences “In Their Own Words”

As we near the Test and Evaluation Phase of the competition starting this August, our Finalists share their thoughts about participating in the Wave Energy Prize “in their own words” to date.

Here are two videos posted earlier this week with advice for opposing teams (by Paul Brewster of Sea Potential, Mike Morrow from M3 Wave and Marcus Lehmann from CalWave) and notes on device evolution (by Stewart Bible of Harvest Wave Energy), respectively.


Advice for Opposing Teams


Device Evolution


A third video, entitled “Innovation” (by Chris Retzler of Alternate team Mocean Energy) is also available.

All videos, recorded during Waterpower Week 2016 in Washington, D.C., can be found archived on the Wave Energy Prize website, as well as the official YouTube channel for the U.S. Department of Energy.

9 Finalists Move Forward in the Wave Energy Prize

MASK-interior-lg

The Wave Energy Prize announced today that the nine finalist teams identified on March 1 will all proceed through Technology Gate 3 to test their 1/20th scale wave energy converter prototypes at the Navy’s Maneuvering and Seakeeping Basin beginning next month. Many thanks to our Wave Energy Prize alternates who continued work on their technologies since March, and we wish the best of luck to the Finalist Teams as they put the finishing touches on their prototypes before shipping them to Carderock!

Wave Energy Prize Program Update: A Look Back at Our First Year, a Look Ahead at Achieving Our Goals

By Alison LaBonte, Ph.D.

Program Manager, Marine and Hydrokinetic Technologies, Wind and Water Technologies Office, U.S. Department of Energy

June 2016 image.png

In 2012, the U.S. Department of Energy (DOE) realized that revolutionary advancements in wave energy were needed for it to play a significant role in our clean energy portfolio, making wave energy a great candidate for a public prize competition. The Wave Energy Prize is not your average research and development program: compressed timelines spark rapid innovation, resulting in revolutionary technology development.

Before we opened registration for the Wave Energy Prize, our team set an aggressive goal to double the state-of-the-art energy captured per unit structural cost of wave energy converters (WECs). With this goal came a number of program objectives, which are to:

  • mobilize new and existing talent,
  • conduct a rigorous comparison between device types,
  • advance the understanding of pathways to achieve long-term levelized cost of energy goals, and
  • attract investors and create a strong foundation for future funding opportunities

So far, we’re achieving these ambitious objectives. A year ago, 92 teams registered for the Prize, three times more than we expected. Of these, 66 turned in technical submissions, which were evaluated by our panel of expert judges to identify 20 Qualified Teams. Most teams that registered were not previously known to DOE. Seventeen of the 20 Qualified Teams’ completed the initial small scale testing phase, and only two of the nine teams selected for the final phase of testing have received any funding from DOE in the past.

In April, I updated the MHK community gathered at Waterpower Week in Washington, D.C., on the progress of the Prize during a panel discussion on innovation. So far, most of the teams have met the aggressive timelines for the Prize, which puts DOE in a great position to achieve the remaining objectives. To meet the requirements for Technology Gate 2, the Qualified Teams built 1/50th-scale model devices, tested them at university facilities around the country, and conducted significant numerical modeling studies in just four months.

The nine Finalist and two Alternate Teams have put forward diverse WEC designs, which include two submerged areal absorbers; four point absorbers; two attenuators; and three terminators. And in these designs, we’re already seeing technical innovations in the areas of geometry, materials, power conversion and controls. Some of these include:

  • adaptive sea state-to-sea state control,
  • wave-to-wave control,
  • power absorption in multiple degrees of freedom,
  • optimized float shapes and dimensions for energy absorption for broad bandwidth of wave frequencies,
  • survival strategies such as submerging beneath the surface for extreme storms,
  • use of structures and materials that are cost effective to manufacture, and
  • flexible membranes that react to the wave pressure over a broad area.

Waterpower Week attendees saw some of these innovations firsthand when they met the Finalists and Alternate Teams during the Wave Energy Prize Showcase in which the 1/50th-scale models were on display.

Industry stakeholders are taking notice, and the public’s awareness of wave energy is increasing because of the teams’ efforts in the Prize. In just over a year, more than 100 news stories have featured the Prize, including in outlets like Popular Science, The Weather Channel and National Geographic. The Prize’s website has hosted more than 23,000 visitors, and its social media channels have logged more than a half million impressions. This increased awareness of the potential contribution of wave energy to the nation’s renewable energy mix will exist long after the Prize ends, and will likely set the stage for future private-sector investments and government funding opportunities.

It’s an exciting time to be in the wave energy community. The teams are putting the finishing touches on their 1/20th-scale prototypes, which will be rigorously tested at the U.S. Navy’s MASK Basin from August through early October. Follow our teams’ progress at waveenergyprize.org, and save the date for November 16, when winner(s), if any, will be announced!

Wave Energy Prize Finalist Teams and Alternates Showcased at Waterpower Week

Photocollage_640x480_V2Wave Energy Prize Finalist and Alternate Teams recently had a unique opportunity to showcase their technologies and network with industry, academic, and government stakeholders during Waterpower Week 2016 in Washington, D.C.

The week’s events kicked off during the National Hydropower Association Annual Conference’s opening plenary session on Monday, April 25 when José Zayas, Director of the U.S. Department of Energy’s Wind and Water Power Technologies Office, highlighted the work of the teams to the more than 700 conference attendees.

Jose Cristin Finalists.jpg

On Monday and Tuesday, the teams had their 1/50th-scale WEC models on display, meeting with Zayas, Cristin Dorgelo, Chief of Staff of the White House Office of Science and Technology, and other event attendees during the conference’s coffee breaks. On Tuesday afternoon, teams switched gears and took part in a Wave Energy Prize Team Summit, a key part of Waterpower Week, where they were able to meet each other and share ideas; learn about the requirements of upcoming Technology Gates 3 and 4; and participate in on-camera interviews discussing their thoughts on the role of government in innovation, their teams’ successes so far, and the challenges they are overcoming in the upcoming final phase of the Prize. The teams then traveled to the MASK Basin at Carderock, Md., on Wednesday morning to better understand the logistical and technical requirements related to 1/20th-scale testing, and to tour the world-class facility where they will test their prototype devices beginning in August.

160427-N-XI735-008.jpg

Thanks to all those who joined us for Waterpower Week and the Team Summit, as well as all those who helped make the event a success!